Evidence Visualization: Using Maltego in the Real World
I’ve been doing a load of research on trying to easily visualize digital forensic data with the hope that patterns, frequencies and clusters would stand out easily. There are already excellent tools that do a great job for primarily email such as NUIX and Intella, but these are pretty expensive beasts. You can also look at software such as I2’s Analyst Notebook but we are talking stratospheric money that is out of my league.
My mind was focused when a friend at the Met Police introduced me to a new tool called Bulk Extractor from Simson Garfinkle which scans across an image and extracts data strings, very quickly, based on a plugin. I set out to run Bulk Extractor against a RAM image and had tremendous results. The tool will extract email addresses, URL’s, search terms, credit card numbers, telephone numbers and others, and does so with aplomb. The tool generates a list of text files that can be analyzed with the Bulk Extractor Viewer. You can run it against disk images, phone memory dumps and RAM. This is great, but when faced with a list of 10,000+ URLS where do you start. This is where some visualization help really comes into play.
After a lot of looking around I came back to a tool I have used many times, Maltego. Maltego is primarily used for the enumeration of Internet data, connecting IP’s, WHOIS, email and domain information to enable the mapping of an online infrastructure. It also enables the importing and graphing of text/csv files.
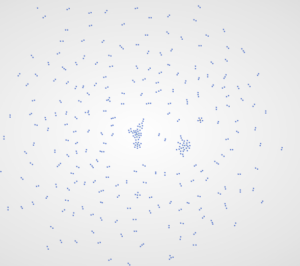
I ran Bulk Extractor against an old 512meg RAM dump and amongst other things it extracted URL links for over 3,000 IP addresses. Normally I would move on quietly(!); however, I tidied up the columns in Excel and imported them into Maltego, mapping the URL address columns. This is what I saw:

Each little cluster represents URL’s linking to a central URL in the hub. A quick look shows the most popular URL’s at the top with many links. Straight away the list of 3,000 is somewhat more manageable if we are interested in popular links.
Zooming down we see:

Although a tad tricky to see that there are little links between the nodes with URL addresses linking to the primary URL, we simply draw around a cluster and then we see:
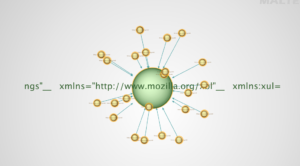
Although the URLs linking in are hard to see, believe me they are there, showing all the URLs that link to the central Mozilla.org URL. How cool is that?
Next I thought IP addresses would be fun, except we had over 10,000 entries from the one RAM dump; however, it mapped very well:
Again there are some very obvious clusters that may be of interest. Scrolling in we see a very definite structure:
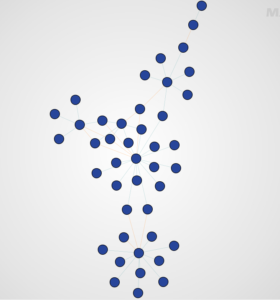
Scrolling in further we see all the interconnected IP’s with a very interesting structure, clusters are grouped together into super-clusters.
Further again and we see the individual addresses:
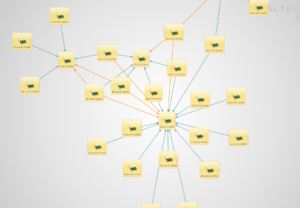
Now we can see each individual connected IP and their port numbers. Maltego really comes into its own. We select the center of the cluster and select the Transform to reverse look up the domain and TLD. As if by magic the graph redraws this cluster and we get:
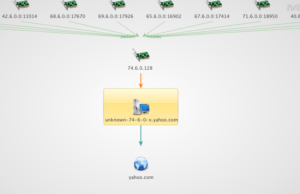
We now can see that all of these IP’s are referencing back to Yahoo.com and it is a very popular cluster in the RAM dump.
Being able to ‘see’ data in this way can help the investigator to quickly zone in on the important areas, seeing, if you like, the wood for the trees.
I’m now doing work on mapping outputs from Volatility and will blog again in a few days.
Cheers.
Written by: Nick Furneaux
We will be posting Nick’s Second Installment on our blog at Social-Engineer.Org